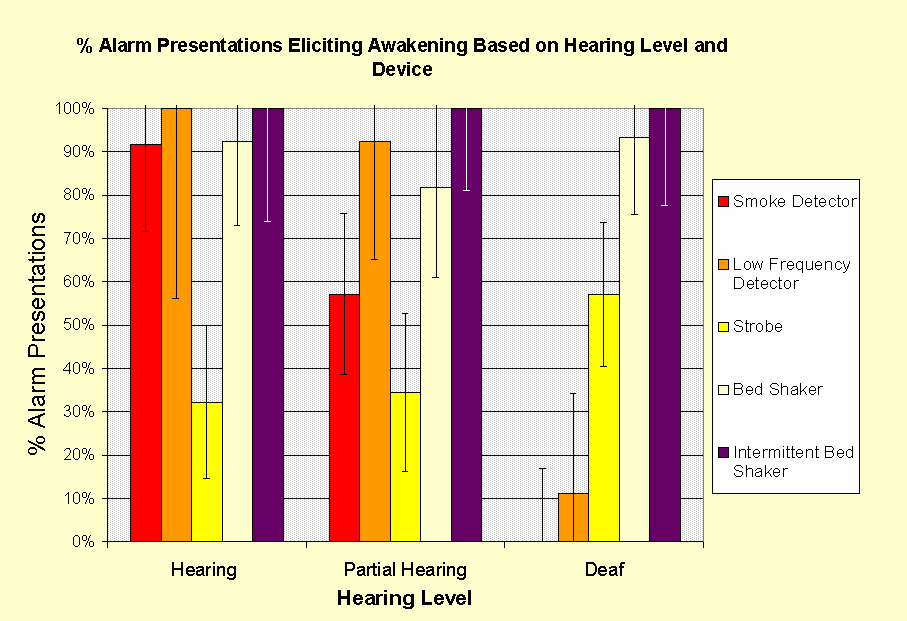
Long Description: The results based on device are clustered into three groups according to hearing ability on the x-axis. On the y axis is the percentage of alarm presentations that successfully awakened people – alarm waking effectiveness or efficiency. What stands out here is the purple bar on the right of each cluster that represents the intermittent bed shaker. According to this data, the intermittent bed shaker was 100% effective for not only normal hearing participants, but also the hard of hearing and deaf. The only other device registering 100% effectiveness was the low frequency detector for normal hearing participants. The effectiveness was a little less, 92% for the hard of hearing, but then it drops off radically to 11% for the deaf. The audible detector and continuous bed shaker measure about 90% for the normal hearing participants, but while the audible smoke detector drops off linearly and registers 0% for the deaf, the continuous shaker stays in the 80-90 percentile for all hearing abilities. The worst performance overall is the strobe which is approximately 30% for the hearing and hard of hearing, and only marginal, 57% for the deaf.