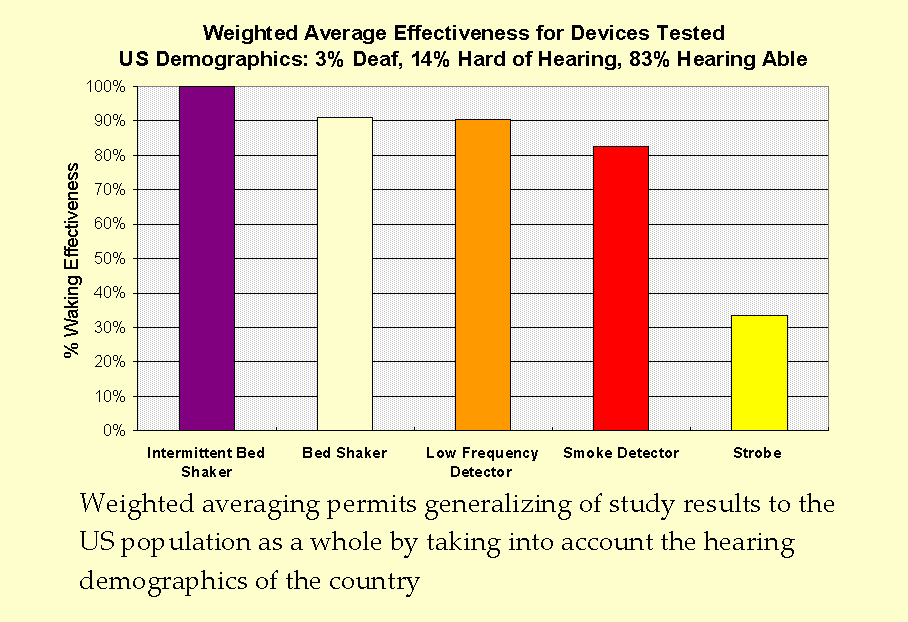
Long Description: Weighted averaging permits generalizing of study results to the US population as a whole by taking into account the hearing demographics of the country. If we were to rate the performance of the devices using a metric that took into account the hearing demographics of the United States population as a whole, we would find the devices ranked according to their weighted waking effectiveness (shown here from left to right) with the Intermittent Bed Shaker as the best, followed by the Continuous bed shaker, the low frequency smoke detector, the audible detector, and finally the strobe.